Resume Metrics: How Job Seekers Can Prove Real Impact

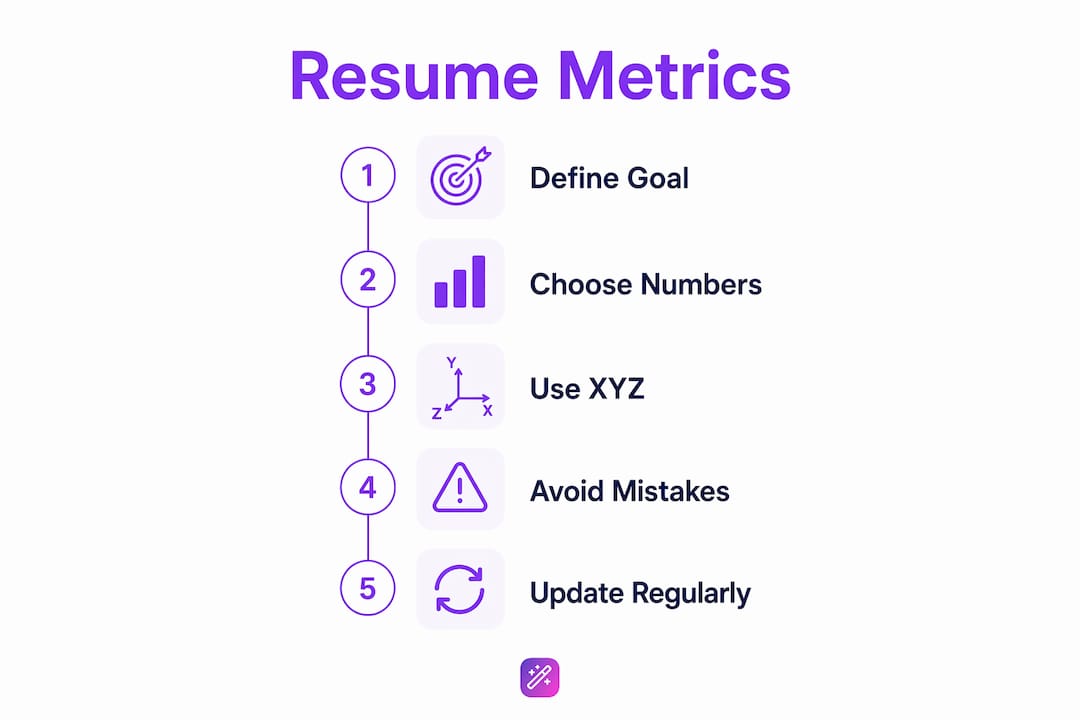
Metrics on a resume do one thing above all else: they prove you delivered results, not just responsibilities. The most effective way to add them is the XYZ formula — Action verb + What you did + Measurable result — applied to your 3–5 biggest accomplishments per role. That formula turns a vague duty line into a concrete business outcome a recruiter can actually picture.
Three quick examples you can copy right now:
- “Reduced customer onboarding time from 2 weeks to 3 days by redesigning the welcome sequence.”
- “Grew organic traffic significantly by consolidating duplicate content and rebuilding internal linking.”
- “Cut monthly cloud spend substantially by rightsizing underutilized EC2 instances.”
Three steps to start editing today:
- Pull up your current resume and highlight every bullet that starts with “Responsible for” or “Managed.”
- For each one, ask: What changed because I did this? By how much? Over what period?
- Rewrite using the XYZ formula and front-load the number whenever it’s the strongest word in the sentence.
Table of Contents
- Why do metrics matter to recruiters and hiring managers?
- How do you write metrics-driven resume bullets?
- Role-specific metric examples you can copy and adapt
- How do you choose the right numbers and timeframes?
- What mistakes should you avoid, and how do you handle confidential numbers?
- How should senior candidates frame KPIs like ARR, churn, and EBITDA?
- Key Takeaways
- The metric most candidates miss
- Easy-cv makes adding metrics to your resume faster
- Useful sources and further reading
Why do metrics matter to recruiters and hiring managers?
A recruiter reviewing a stack of applications is not reading for nuance. They are scanning for signals that you have done the job before and produced results worth paying for. A bullet that says “managed social media accounts” tells them nothing about scale, skill, or outcome. A bullet that says “grew LinkedIn following from 4,200 to 11,800 in 12 months, driving a 34% increase in inbound demo requests” tells them almost everything they need to know.
Numbers also reduce ambiguity. When you write “led a large team,” every reader imagines a different number. When you write “led a team of 14 engineers,” the picture is fixed. That specificity builds credibility fast, especially when a hiring manager has 90 seconds per resume.
There is also an ATS dimension. Applicant tracking systems parse resumes for keywords and resume keywords that match the job description. Quantified bullets often contain the exact language a JD uses: “revenue growth,” “cost reduction,” “retention rate.” A metric-rich resume naturally picks up more of those signals without forcing keyword stuffing.
The business outcomes recruiters care most about cluster into five categories:
- Revenue and growth: sales figures, ARR, pipeline generated, conversion rates
- Cost and efficiency: savings achieved, process time reduced, headcount avoided
- Scale and volume: users served, transactions processed, SKUs managed
- Quality and accuracy: error rates, customer satisfaction scores, defect reduction
- Speed: time-to-hire, deployment frequency, project delivery ahead of schedule
Pro Tip: Front-load your most relevant metric at the very top of each role’s bullet list. Recruiters read the first bullet of each position most carefully — put your strongest number there, not buried in bullet five.
How do you write metrics-driven resume bullets?
The XYZ formula is the cleanest framework for this: Action verb + What you did + Measurable result. Yale’s Office of Career Strategy recommends this structure specifically because it ties accomplishments to business outcomes rather than listing tasks.

Role-agnostic templates
Use these as starting points, then swap in your own numbers and context:
- “Increased [metric] by [X%] in [timeframe] by [method].”
- “Reduced [cost/time/error rate] from [baseline] to [result] through [action].”
- “Generated $[X] in [revenue/savings] by [initiative].”
- “Managed [X] [clients/accounts/projects] with a [Y%] retention/satisfaction rate.”
- “Delivered [project/feature] [X days/weeks] ahead of schedule, saving $[Y].”
- “Trained [X] staff, reducing [onboarding time/error rate] by [Y%].”
- “Grew [channel/metric] from [baseline] to [result] within [timeframe].”
- “Maintained [X%] accuracy/uptime across [scope] over [period].”
Before and after: what the rewrite looks like
| Before (task-based) | After (result-based) |
|---|---|
| Managed a team of sales executives | Led 5 sales executives, growing quarterly revenue 30% in 6 months |
| Worked on website performance | Improved page load speed 40%, cutting bounce rate substantially |
| Handled customer complaints | Resolved 95% of complaints within 24 hours, lifting satisfaction scores 20% |
| Responsible for hiring | Reduced time-to-hire from 52 days to 29 days by introducing structured interview scorecards |
Eight editing rules
- Start every bullet with a past-tense action verb — “Built,” “Reduced,” “Launched,” not “Responsible for.”
- Place the number as early in the sentence as it reads naturally.
- Use “$” for dollar amounts, “%” for rates, and spell out units when they might be ambiguous.
- Include a timeframe whenever it changes the meaning (“in Q3,” “over 18 months”).
- Pair a percentage with an absolute when the base matters (“grew revenue 40% — from $500K to $700K”).
- Avoid meaningless counts: “attended 12 meetings” is not an accomplishment.
- Never use a metric you cannot explain in an interview.
- Limit yourself to 3–5 quantified bullets per role so the standout numbers actually stand out.
Editing checklist before you finalize
- Defendable: Can you reconstruct this number from memory, a report, or a calendar?
- Baseline: Does the reader know what you started from?
- Timeframe: Is the period stated or clearly implied?
- Context: Is the scope (team, department, company-wide) clear?
Dos and don’ts
| Do | Don’t |
|---|---|
| Use conservative, defensible estimates | Inflate totals or cherry-pick the best single month |
| Show percentages with a base (“from $X to $Y”) | Write “increased revenue 500%” with no baseline |
| Tie numbers to actions you personally drove | Claim credit for company-wide results you influenced marginally |
| Round to a clean number you can defend | Invent false precision (“increased efficiency by 17.3%”) |
Pro Tip: If you genuinely cannot find an exact figure, defensible estimates — ranges, approximations, or conservative rounding — are acceptable as long as you can explain your methodology if asked.
Role-specific metric examples you can copy and adapt
Career experts consistently recommend tying metrics to business outcomes so recruiters can visualize your contribution to their goals. The bullets below are organized by function and seniority. Swap in your own numbers; the structure is the point.
Marketing
- Junior: “Scheduled and published 5 social posts per week, growing Instagram engagement rate from 1.8% to 3.4% in 4 months.”
- Mid: “Launched a 6-email nurture sequence that converted 22% of trial users to paid within 30 days.”
- Senior: “Owned a $1.2M paid media budget, delivering a 3.8x blended ROAS across Google and Meta over 12 months.”
Sales
- Junior: “Averaged 80 cold calls per day, booking 12 qualified demos weekly against a team target of 8.”
- Mid: “Closed $740K in new ARR in FY2024, finishing 118% of quota.”
- Senior: “Built and led a 9-person enterprise sales team, growing the division from $2.1M to $5.4M ARR in 24 months.”
Engineering
- Junior: “Reduced API response time from 420ms to 95ms by refactoring three high-traffic endpoints.”
- Mid: “Shipped a CI/CD pipeline that cut deployment time from 4 hours to 22 minutes and reduced rollback incidents by 60%.”
- Senior: “Architected a microservices migration for a monolith serving 2M daily active users, improving uptime from 99.1% to 99.97%.”
Product
- Junior: “Conducted 30 user interviews that surfaced 5 friction points; fixes reduced drop-off at onboarding step 3 by 28%.”
- Mid: “Launched a self-serve onboarding flow that increased 7-day activation from 41% to 67%.”
- Senior: “Defined and shipped a pricing overhaul that lifted average contract value 35% without increasing churn.”
HR and Talent
- Junior: “Screened 200+ applications per month, maintaining a 48-hour response SLA for all candidates.”
- Mid: “Reduced time-to-hire from 52 days to 29 days by introducing structured interview scorecards.”
- Senior: “Designed a company-wide performance framework adopted by 600 employees, improving eNPS from 22 to 41.”
Customer Success
- Junior: “Managed a portfolio of 85 SMB accounts with a 94% renewal rate over 12 months.”
- Mid: “Drove net revenue retention to 112% by identifying and executing upsell opportunities across 40 enterprise accounts.”
- Senior: “Built a CS team of 11 from scratch, achieving a department-wide NPS of 68 within the first year.”
Operations and Supply Chain
- Junior: “Processed 150+ purchase orders weekly with a 99.2% accuracy rate.”
- Mid: “Renegotiated 3 vendor contracts, saving $220K annually without reducing service levels.”
- Senior: “Redesigned warehouse pick-and-pack workflow, cutting fulfillment time 38% and reducing labor cost per unit by $0.42.”
Data and Analytics
- Junior: “Built a weekly KPI dashboard in Tableau used by 4 department heads to track pipeline health.”
- Mid: “Developed a churn prediction model with 81% accuracy, enabling proactive outreach that recovered $180K in at-risk ARR.”
- Senior: “Led a data platform migration to Snowflake, reducing query run time 70% and cutting infrastructure costs $95K/year.”
Design and UX
- Junior: “Redesigned the checkout flow based on 15 usability tests, reducing cart abandonment 18%.”
- Mid: “Delivered a full design system (120+ components) that cut new-feature design time from 3 weeks to 4 days.”
- Senior: “Directed UX research across 6 product lines, contributing to a 22-point increase in overall product NPS.”
Education and Nursing (brief examples)
- Teacher: “Raised average state test scores 14 percentile points over 2 years by introducing weekly formative assessments.”
- Nurse: “Maintained a 0% medication error rate across 1,200+ patient interactions over 18 months.”
Adapting any bullet to your situation: Replace the number with your own figure, adjust the timeframe to match your tenure, and swap the method clause to reflect what you actually did. If the bullet covers a team effort, add “as part of a 4-person team” or “contributing to” to keep it accurate.
How do you choose the right numbers and timeframes?
The period you choose changes the story the number tells. A 5% monthly growth rate sounds modest; compounded over a year it becomes 80%. Neither is wrong, but one lands harder. Pick the window that most honestly represents your contribution, and be ready to explain why you chose it.
Timeframe rules of thumb:
- Use the full tenure when your impact built over time (e.g., a culture initiative or a long product cycle).
- Use a quarter or campaign window when results were concentrated and the annual view would dilute them.
- Use before/after comparisons whenever you inherited a baseline and improved it — this is the clearest format for showing change.
Absolute vs. percentage: when to use each
Large absolute numbers ($2M in savings) impress when the base is unknown. Percentages (reduced costs 40%) impress when the base is known and the rate of change is the story. The strongest bullets often include both: “cut processing costs $340K, a 28% reduction on the prior-year budget.” That pairing gives the reader two ways to process the scale.

Rounding and conservative framing
You do not need exact figures. Defensible estimates — ranges, approximations, or conservative rounding — are fully acceptable, provided you can explain your methodology in an interview. Use “50+”, “~200,” or “30–40%” when precision is unavailable. Always round down, not up. A conservative number you can defend beats an inflated one that unravels under a single follow-up question.
Pro Tip: When you are unsure whether to use a monthly or annual figure, ask yourself which one the hiring manager’s job description is written around. A VP of Sales cares about ARR; a campaign manager cares about monthly ROAS. Match the metric’s cadence to the role’s cadence.
What mistakes should you avoid, and how do you handle confidential numbers?
Some widely repeated claims about exact percentage lifts from adding metrics lack robust peer-reviewed evidence. The real case for quantifying your resume is simpler: it forces clarity, reduces ambiguity, and gives recruiters something concrete to discuss. That is enough. You do not need to chase fabricated benchmarks.
Common mistakes that undermine credibility:
- Inflated totals: Claiming credit for a company-wide result when your role was one of ten contributors.
- Percentages without a base: “Increased revenue 300%” with no starting point is meaningless and suspicious.
- Vanity metrics: “Sent 5,000 emails” is a volume count, not an outcome. Pair it with open rate, reply rate, or pipeline generated.
- Burying context: “Reduced costs by $1M” reads very differently at a startup vs. a Fortune 500. State the scope.
- False precision: “Improved efficiency by 17.3%” looks invented. Round to a number a human would actually track.
Handling NDA-protected or confidential figures
Many roles involve proprietary data you cannot publish. That does not mean you have to leave the bullet blank. Use these approaches:
- Switch to percentages: “Contributed to a cost reduction of ~20% across a multi-million-dollar program” reveals no proprietary dollar figure.
- Use relative terms: “Reduced churn from above-industry-average to below the SaaS median” conveys direction without disclosing the exact rate.
- Scope the contribution: “As one of three leads on a $XM initiative, drove the vendor consolidation workstream that delivered the majority of savings.”
- Prepare a verbal expansion: In the interview, you can say “I can share the percentage but not the absolute figure due to an NDA” — that answer actually builds trust.
Verification checklist: how to reconstruct numbers you never formally tracked
- Check old performance reviews, OKR documents, or quarterly business reviews you were copied on.
- Pull calendar data: how many calls, sessions, or events per week? Multiply by tenure weeks.
- Ask a former colleague or manager to confirm your recollection — this also gives you a reference who can speak to the number.
- Use reconstruction methods like team size, budget size, frequency, and before/after comparisons to arrive at a defensible estimate.
- Document your methodology in a notes file so you can explain it fluently in an interview.
How should senior candidates frame KPIs like ARR, churn, and EBITDA?
Quantifying achievements shifts attention from tenure to outcomes — and for senior candidates, that shift is the whole game. A hiring committee evaluating a VP or C-suite candidate is not reading for job duties. They want to know what moved under your watch and why.
The KPIs that matter at the leadership level map directly to board-level concerns:
| KPI | What it signals | Suggested resume phrasing template |
|---|---|---|
| ARR / Revenue growth | Commercial scale and growth trajectory | “Grew ARR from $X to $Y in [period] by [GTM action]” |
| Gross margin | Pricing discipline and cost management | “Expanded gross margin from X% to Y% through [pricing/vendor action]” |
| Churn rate | Customer retention and product-market fit | “Reduced annual churn from X% to Y% by [retention initiative]” |
| LTV | Customer quality and monetization depth | “Increased average LTV $X through [upsell/expansion motion]” |
| EBITDA | Operational efficiency at scale | “Improved EBITDA margin X pts by [cost structure or revenue mix change]” |
| Cost of revenue | Delivery efficiency | “Cut cost of revenue from X% to Y% by [automation/vendor renegotiation]” |
Senior-level sample bullets
- “Drove ARR from $8.2M to $19.7M in 30 months by launching a mid-market segment and repricing the enterprise tier.”
- “Reduced annual gross churn from 18% to 9% by building a dedicated renewal team and introducing 90-day health scoring.”
- “Expanded EBITDA margin 6 percentage points over 2 years by consolidating 3 redundant platforms and renegotiating the top 5 vendor contracts.”
- “Grew LTV from $4,200 to $7,800 by introducing a professional services upsell motion across the existing customer base.”
For leadership resumes, map KPIs directly to actions and strategy items mentioned in the target job description. If the JD says “scale revenue operations,” your ARR bullet belongs in the summary, not buried in the third role.
Interview prep for executive metrics: Hiring committees will ask how you measured it, what the baseline was, and what specifically you did versus what the market did for you. Prepare a two-sentence explanation for each KPI: the action you took, the mechanism by which it produced the result, and the timeframe. That preparation also tells you whether the metric is defensible enough to include.
According to The Connors Group, senior-level candidates should replace lists of responsibilities with a track record of business outcomes and map resume KPIs to themes in the job description.
Key Takeaways
Metrics prove impact, make results scannable, and connect your work to employer outcomes — applied through the XYZ formula across your 3–5 biggest accomplishments per role.
| Point | Details |
|---|---|
| Use the XYZ formula | Write every key bullet as: Action verb + What you did + Measurable result. |
| Limit to 3–5 metrics per role | Quantify only your biggest wins so standout numbers don’t get lost in the noise. |
| Pair percentages with absolutes | Include both the rate and the dollar/unit figure when the base matters to the reader. |
| Confidential figures have workarounds | Use percentages, relative terms, or scoped contribution language to stay NDA-safe. |
| Easy-cv speeds the process | Easy-cv’s AI writing assistant and metric-aware templates help you draft and refine defensible, quantified bullets fast. |
The metric most candidates miss
Most resume advice focuses on which numbers to add. The harder question is why so many candidates skip them entirely, and the answer is usually not laziness. It is that people genuinely do not know what they are allowed to claim.
Here is the thing: you do not need a formal performance report to write a metric-driven resume. You need a habit. Keep a running document, updated quarterly, that logs what you shipped, what changed, and roughly by how much. Even rough notes, “we cut the review cycle from about 3 weeks to under a week,” give you the raw material to reconstruct a defensible bullet later. The candidates who consistently land interviews are not the ones with the most impressive numbers. They are the ones who tracked their work well enough to talk about it specifically.
One more thing worth saying plainly: metrics are more effective than adjectives because they force the reader to process scale and impact rather than take your word for it. “Highly motivated self-starter” is a claim. “Closed $1.1M in new business in year one” is evidence. Recruiters are paid to be skeptical of claims and persuaded by evidence. Give them evidence.
Easy-cv makes adding metrics to your resume faster
If you have spent time in this article building a mental model of what a metric-driven resume looks like, the next step is actually writing one. Easy-cv’s AI-powered CV builder is built for exactly this workflow. The AI writing assistant drafts and refines bullet points in the XYZ format, so you are not staring at a blank line trying to remember how to phrase a 40% cost reduction. The ATS-friendly templates are laid out so your headline metrics land where recruiters look first.
The job matcher scans your CV against live job descriptions and surfaces the KPI language each role uses, so you know which of your metrics to front-load before you apply. If you are applying across markets, the CV translator preserves your metric formatting across 30+ languages without mangling the numbers.
Getting started takes three steps: create a free account, paste in your current resume, and let the AI flag every bullet that lacks a measurable result. From there, you rewrite with the XYZ formula and the role-specific examples in this article as your guide. Your resume, with real numbers that you can defend, ready to send.
Useful sources and further reading
The sources below are worth bookmarking, especially when you need to reconstruct numbers or prepare interview explanations for the metrics on your resume.
| Source | What it supports |
|---|---|
| Yale OCS — Writing Impactful Resume Bullets | Primary reference for the XYZ formula and before/after framing |
| The Connors Group — Resume Metrics Best Practices | Guidance on how many metrics to include and senior KPI mapping |
| PassTheScan — Quantify Resume Achievements | Reconstruction methods and senior-level positioning |
| WriteCV.ai — Quantify Resume Bullets | Defensible estimates, ranges, and role-specific examples |
| University of Colorado Boulder — Resumes | Institutional guidance on measurable, verifiable resume statements |
| Bridget Batson — Metrics vs. Adjectives | Why numbers outperform descriptive language for recruiter credibility |
| dev.to — What Science Says About CVs | Caveat on unsupported statistics; evidence-based framing |
| Easy-cv — Resume Checklist | Post-article checklist for applying these recommendations |
| Easy-cv — Achievements in Resumes | Recruiter preferences for metric-based experience sections |
Consult the Yale OCS and University of Colorado pages when you need to defend your methodology to a skeptical interviewer. Use the PassTheScan reconstruction guide when you are working from memory rather than formal reports. The Easy-cv checklist is the fastest way to audit your resume against everything covered here before you hit send.